1. Create an Event Hub
To start sending logs, you need to create an Event hub. You can follow these instructions to easily set up an Event Hub. When creating the Event hub, we recommend setting the Retention time (hrs) to the minimum allowed value of 1. Limit the number of partitions for your Event Hub to 100.2. Add Shared Access Policy to Event Hub
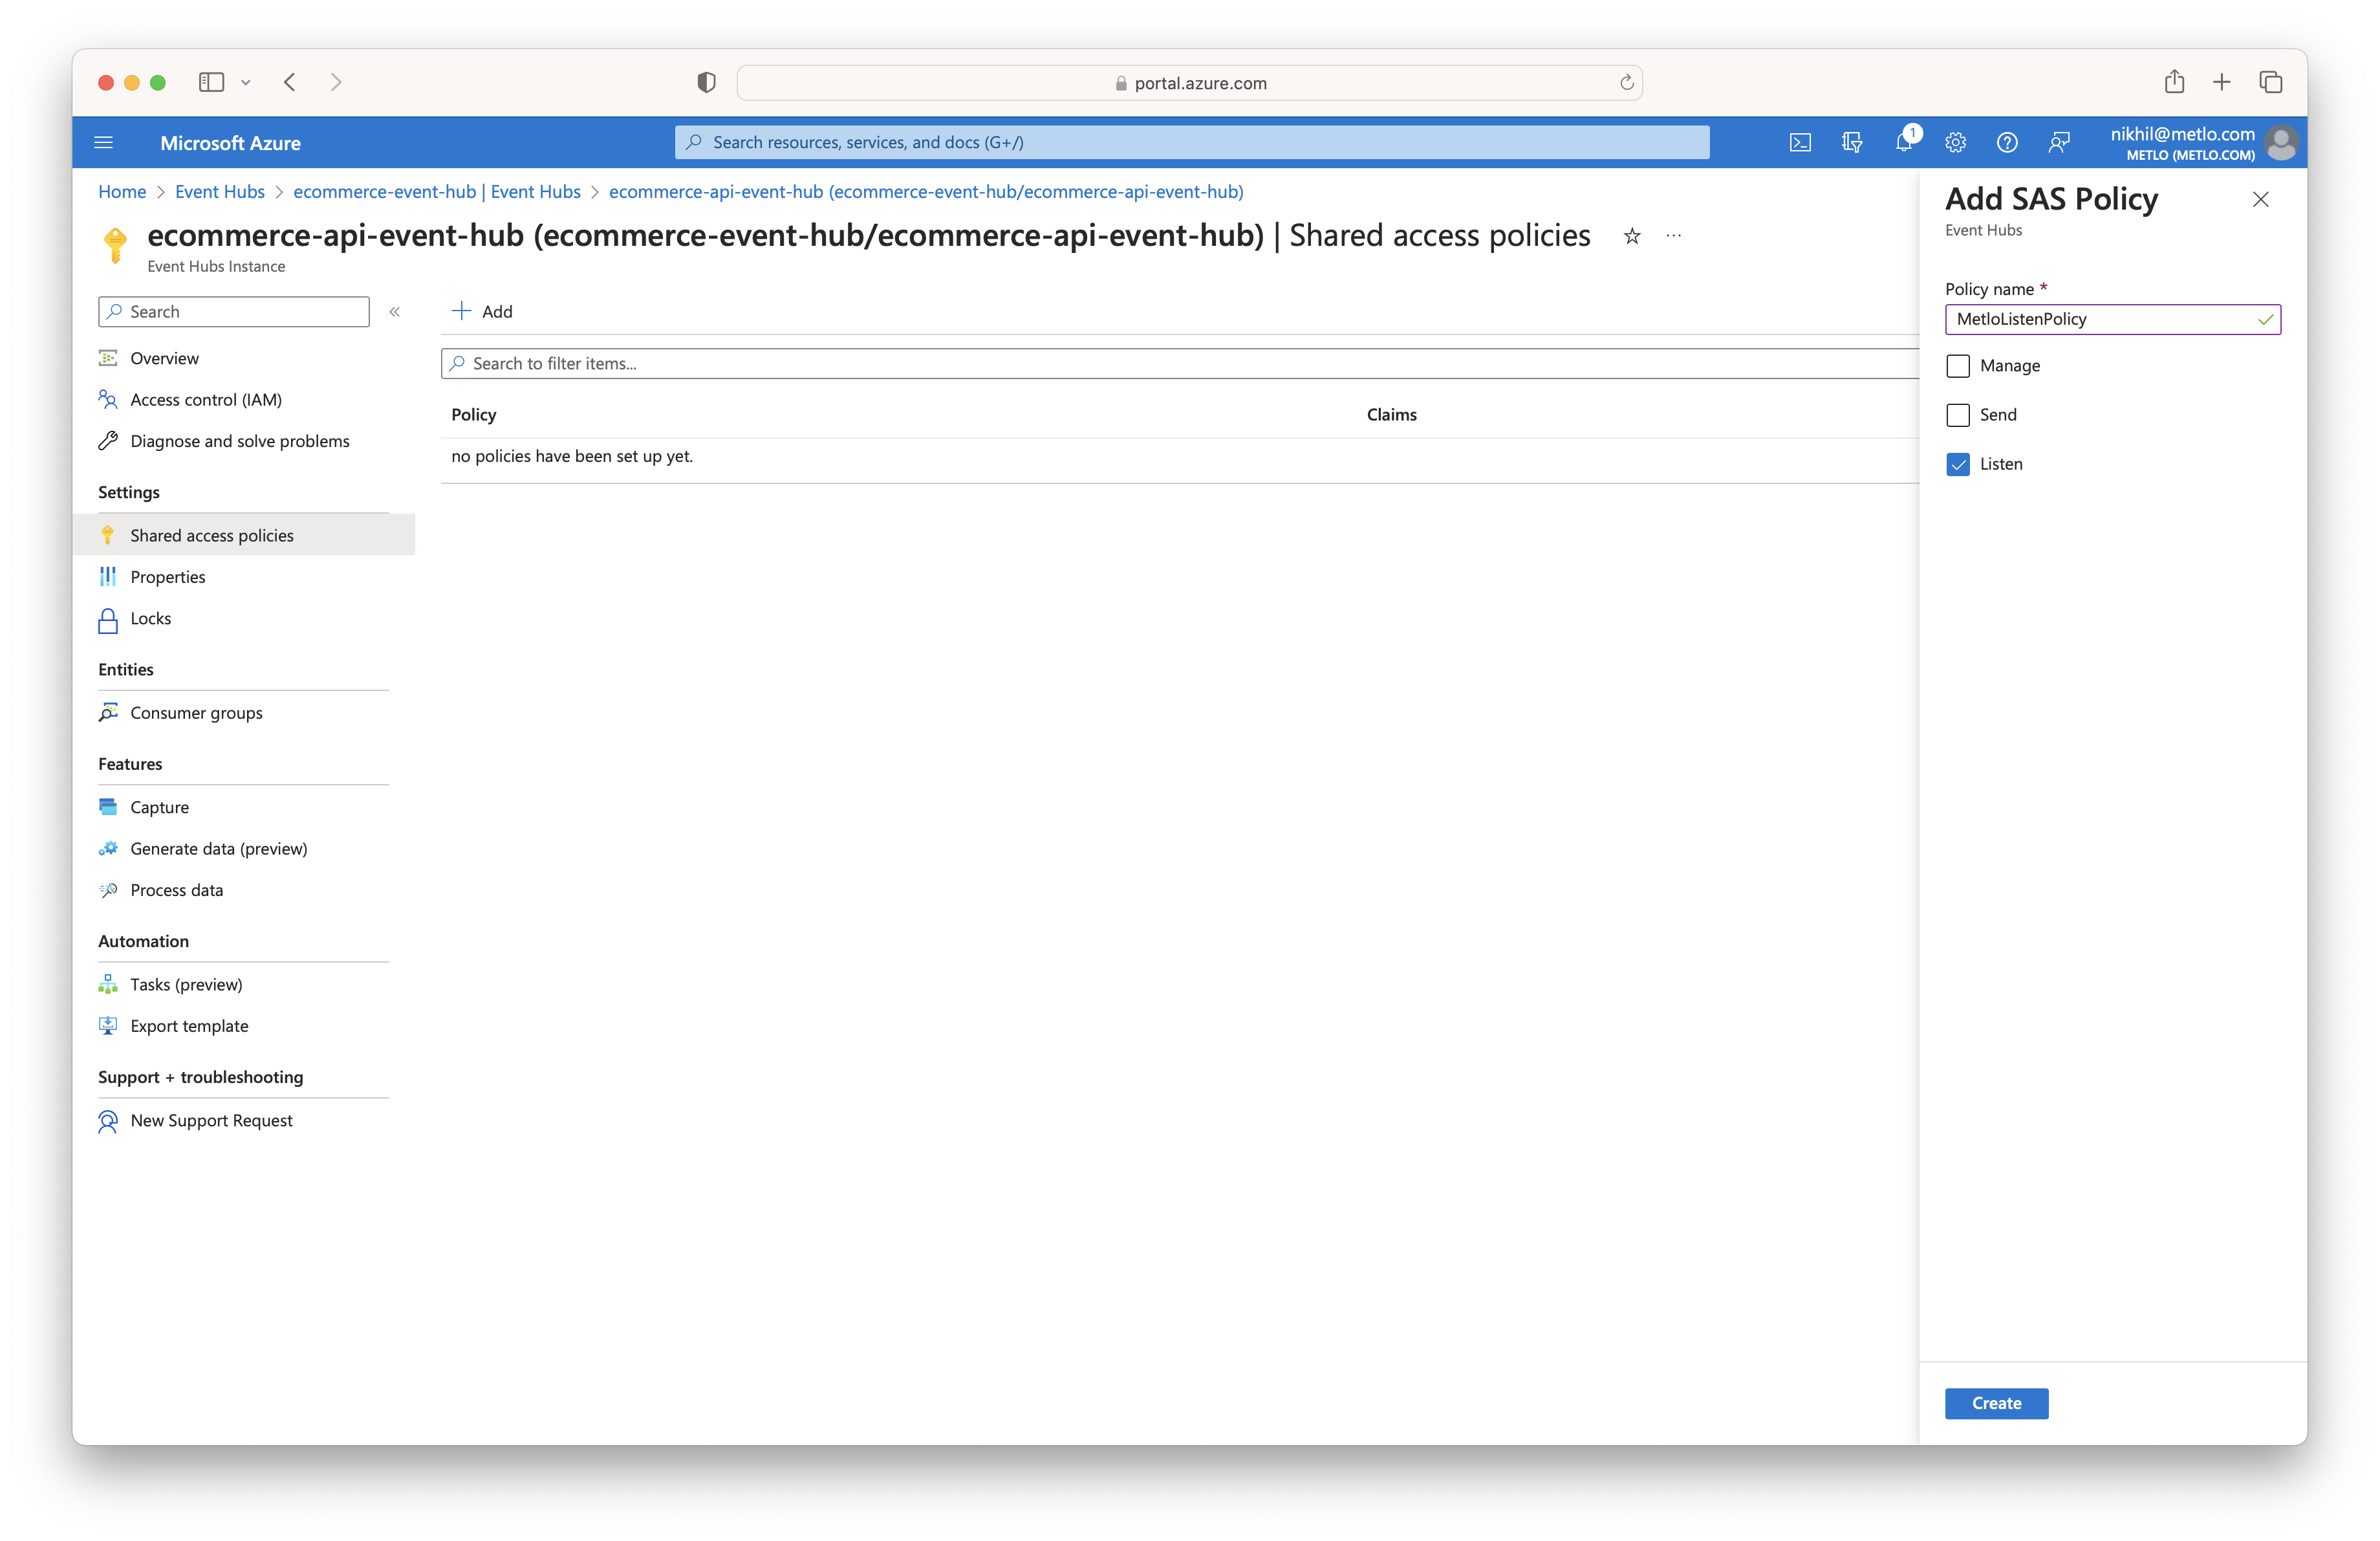
Navigate to the event hub that was created previously (ensure that you navigate to the event hub and not the event hub namespace). Select Shared access policies in the left menu and click on the Add button. Fill inMetloListenPolicy
for the Policy name, check the Listen checkbox, and then click on the Create button on the bottom.
This will generate shared access credentials that the Metlo agent can use to consume the logs that are being sent
to this event hub.
3. Modify API Settings
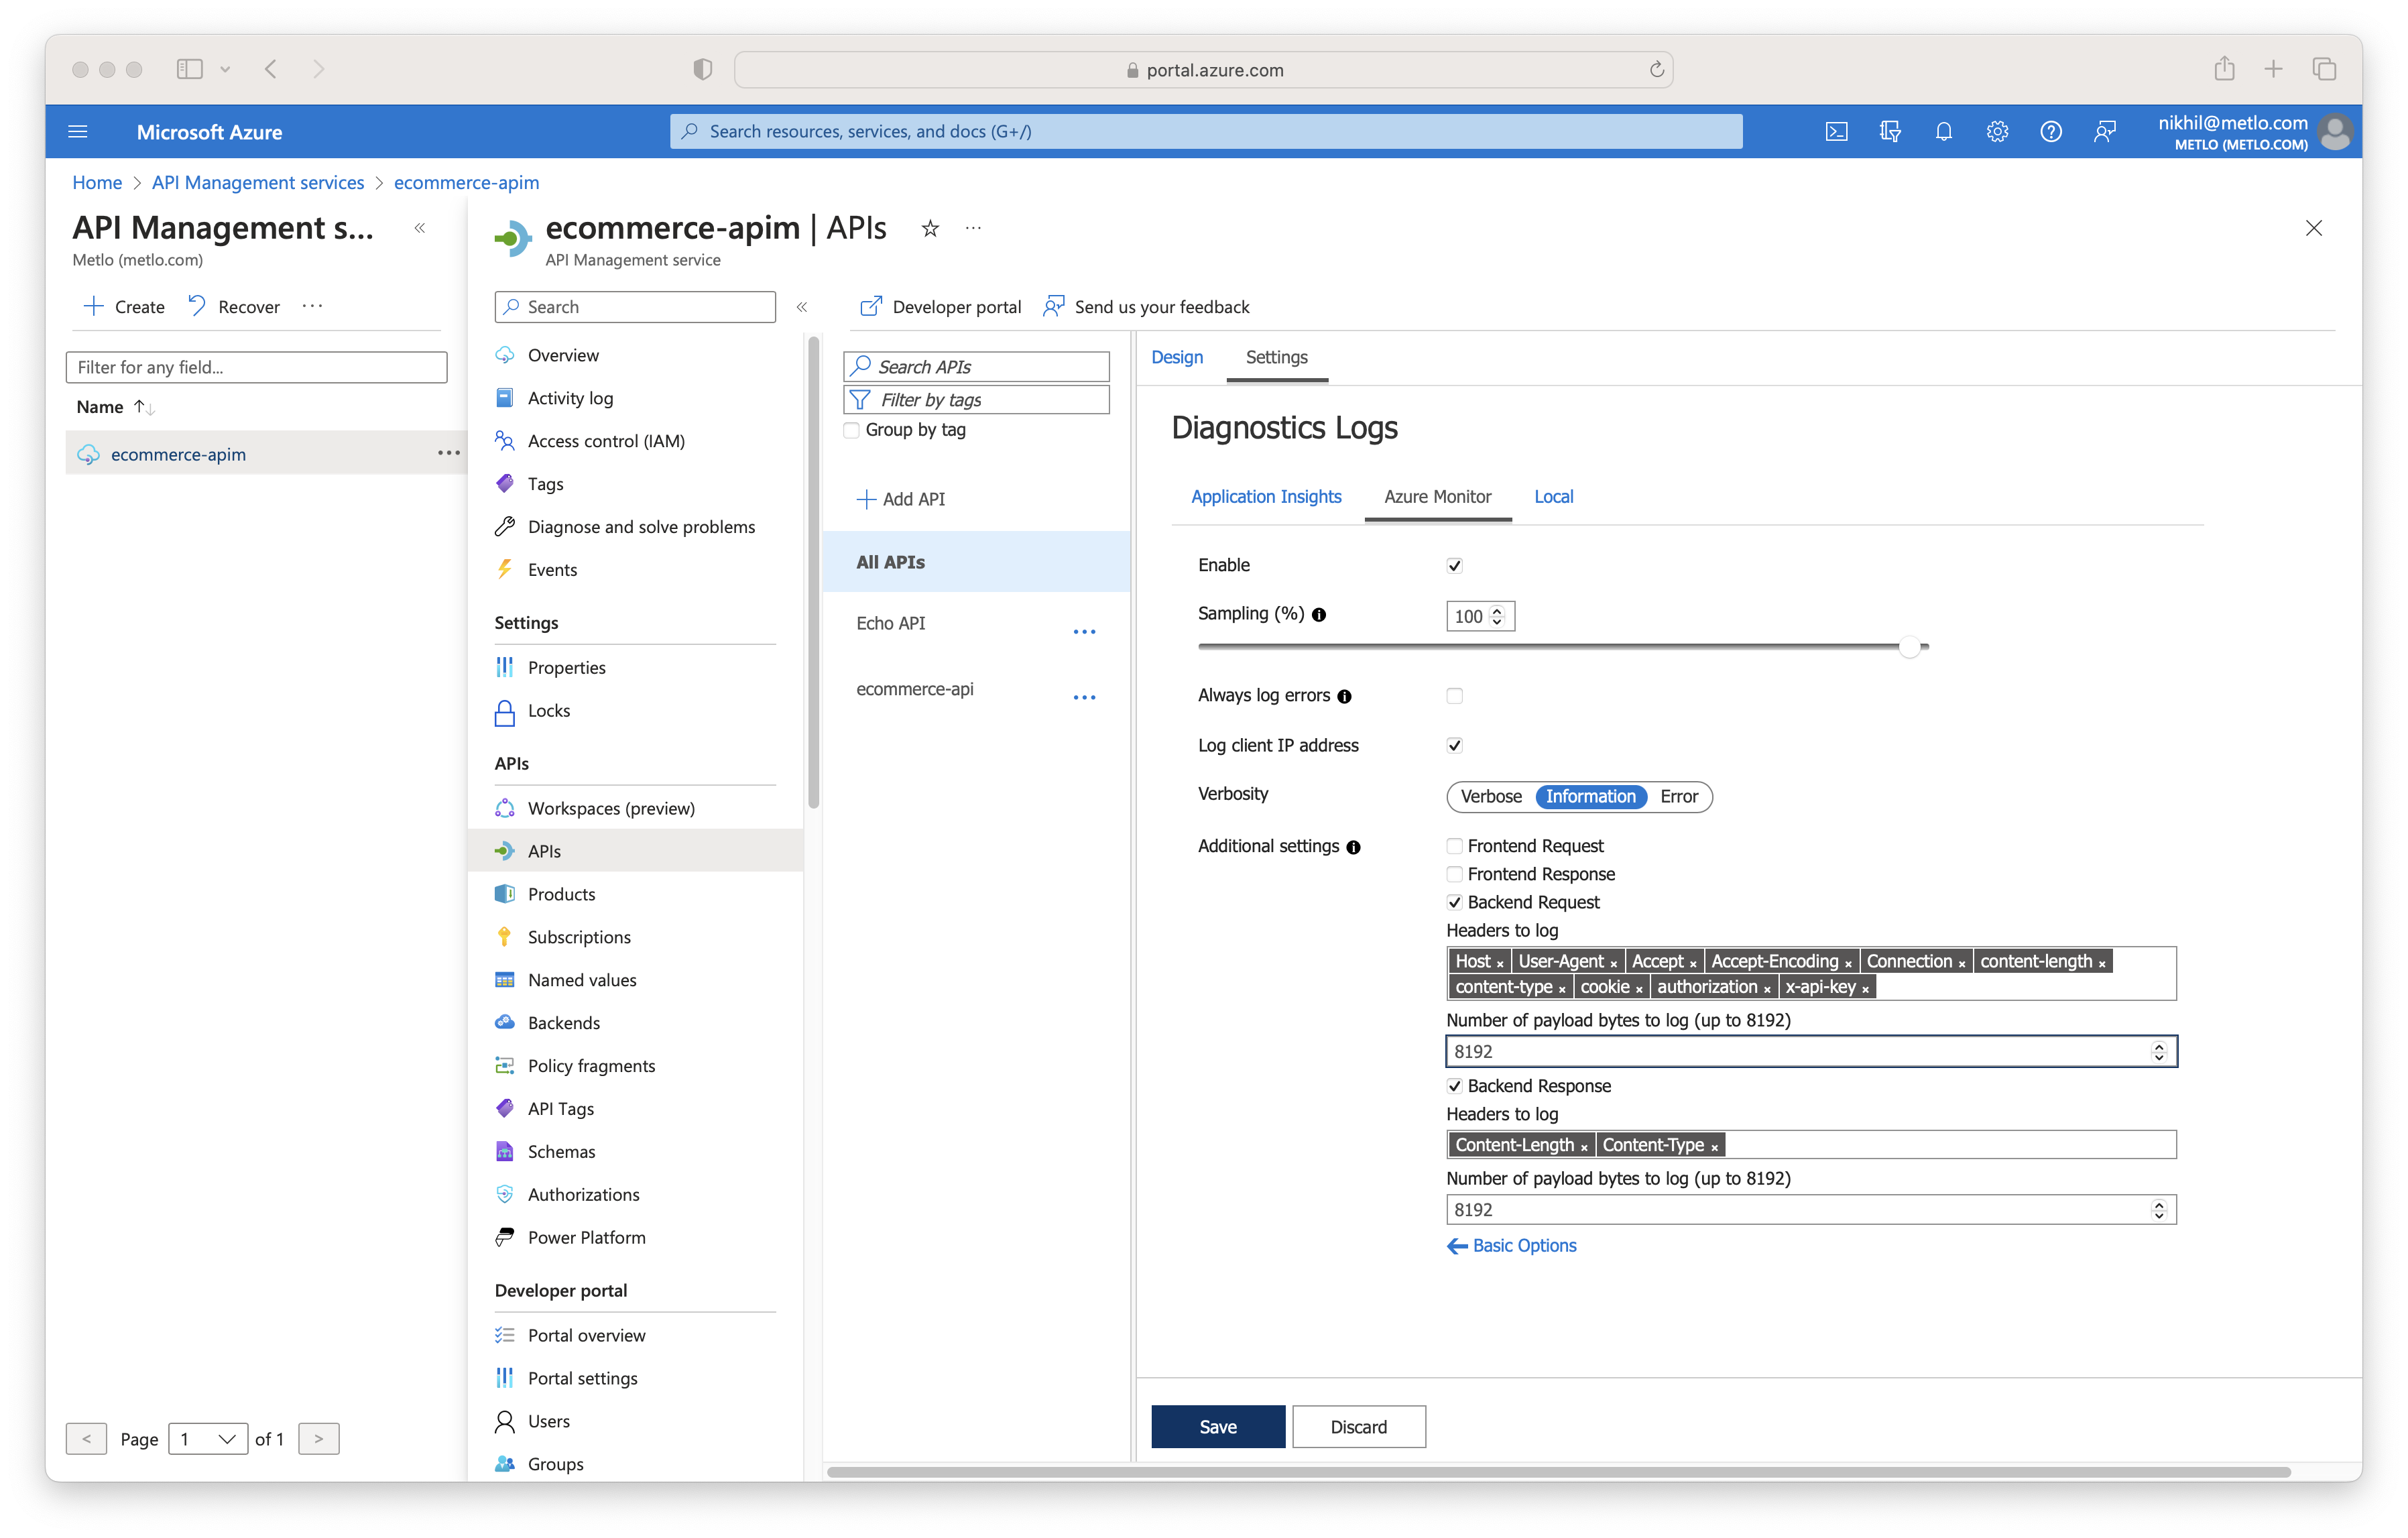
To get the proper data in the Diagnostic Logs, update the Settings for Diagnostic Logs in your API Management service. Go to your API Management service and select APIs in the left menu. Next, click on All APIs or on the specific API. Then, select the Settings tab on top and click on the Azure Monitor tab of the Diagnostic Logs section. Now, check the Override global checkbox, set Sampling to100,
uncheck Always log errors, check Log client IP address, and set Verbosity to Information.
To log any request and response headers sent to your APIs, you have to provide a list of the Headers
to log in the Backend Request and Backend Response section. Some headers to include would be:
Request
- Host
- User-Agent
- Accept
- Accept-Encoding
- Connection
- Content-Length
- Content-Type
- Cookie
- Authorization
- Content-Length
- Content-Type
4. Create Diagnostic setting
Select Diagnostic settings in the left menu and click on Add diagnostic setting. Enter a name for the diagnostic setting, then check theLogs related to ApiManagement Gateway checkbox.
Now, check the Stream to an event hub option under the Destination details section and fill in the
information for the event hub you created earlier. Once you have finished, click on the Save button
in the top left.
When you first add the diagnostic setting, it could take up to 30 minutes before the logs are available
to be consumed by the metlo agent.
5. Set up Metlo Agent
Go to Container Instances in the Azure Portal and click Create. Fill in the necessary information for the Project details and selectOther registry for the Image source and select the Public
option for Image type. In the Image input field, enter metlo/azure-event-hub-agent:latest and then select
Linux for the OS type. Ensure you have at least 2 CPU Cores and 4 GB of Memory selected.
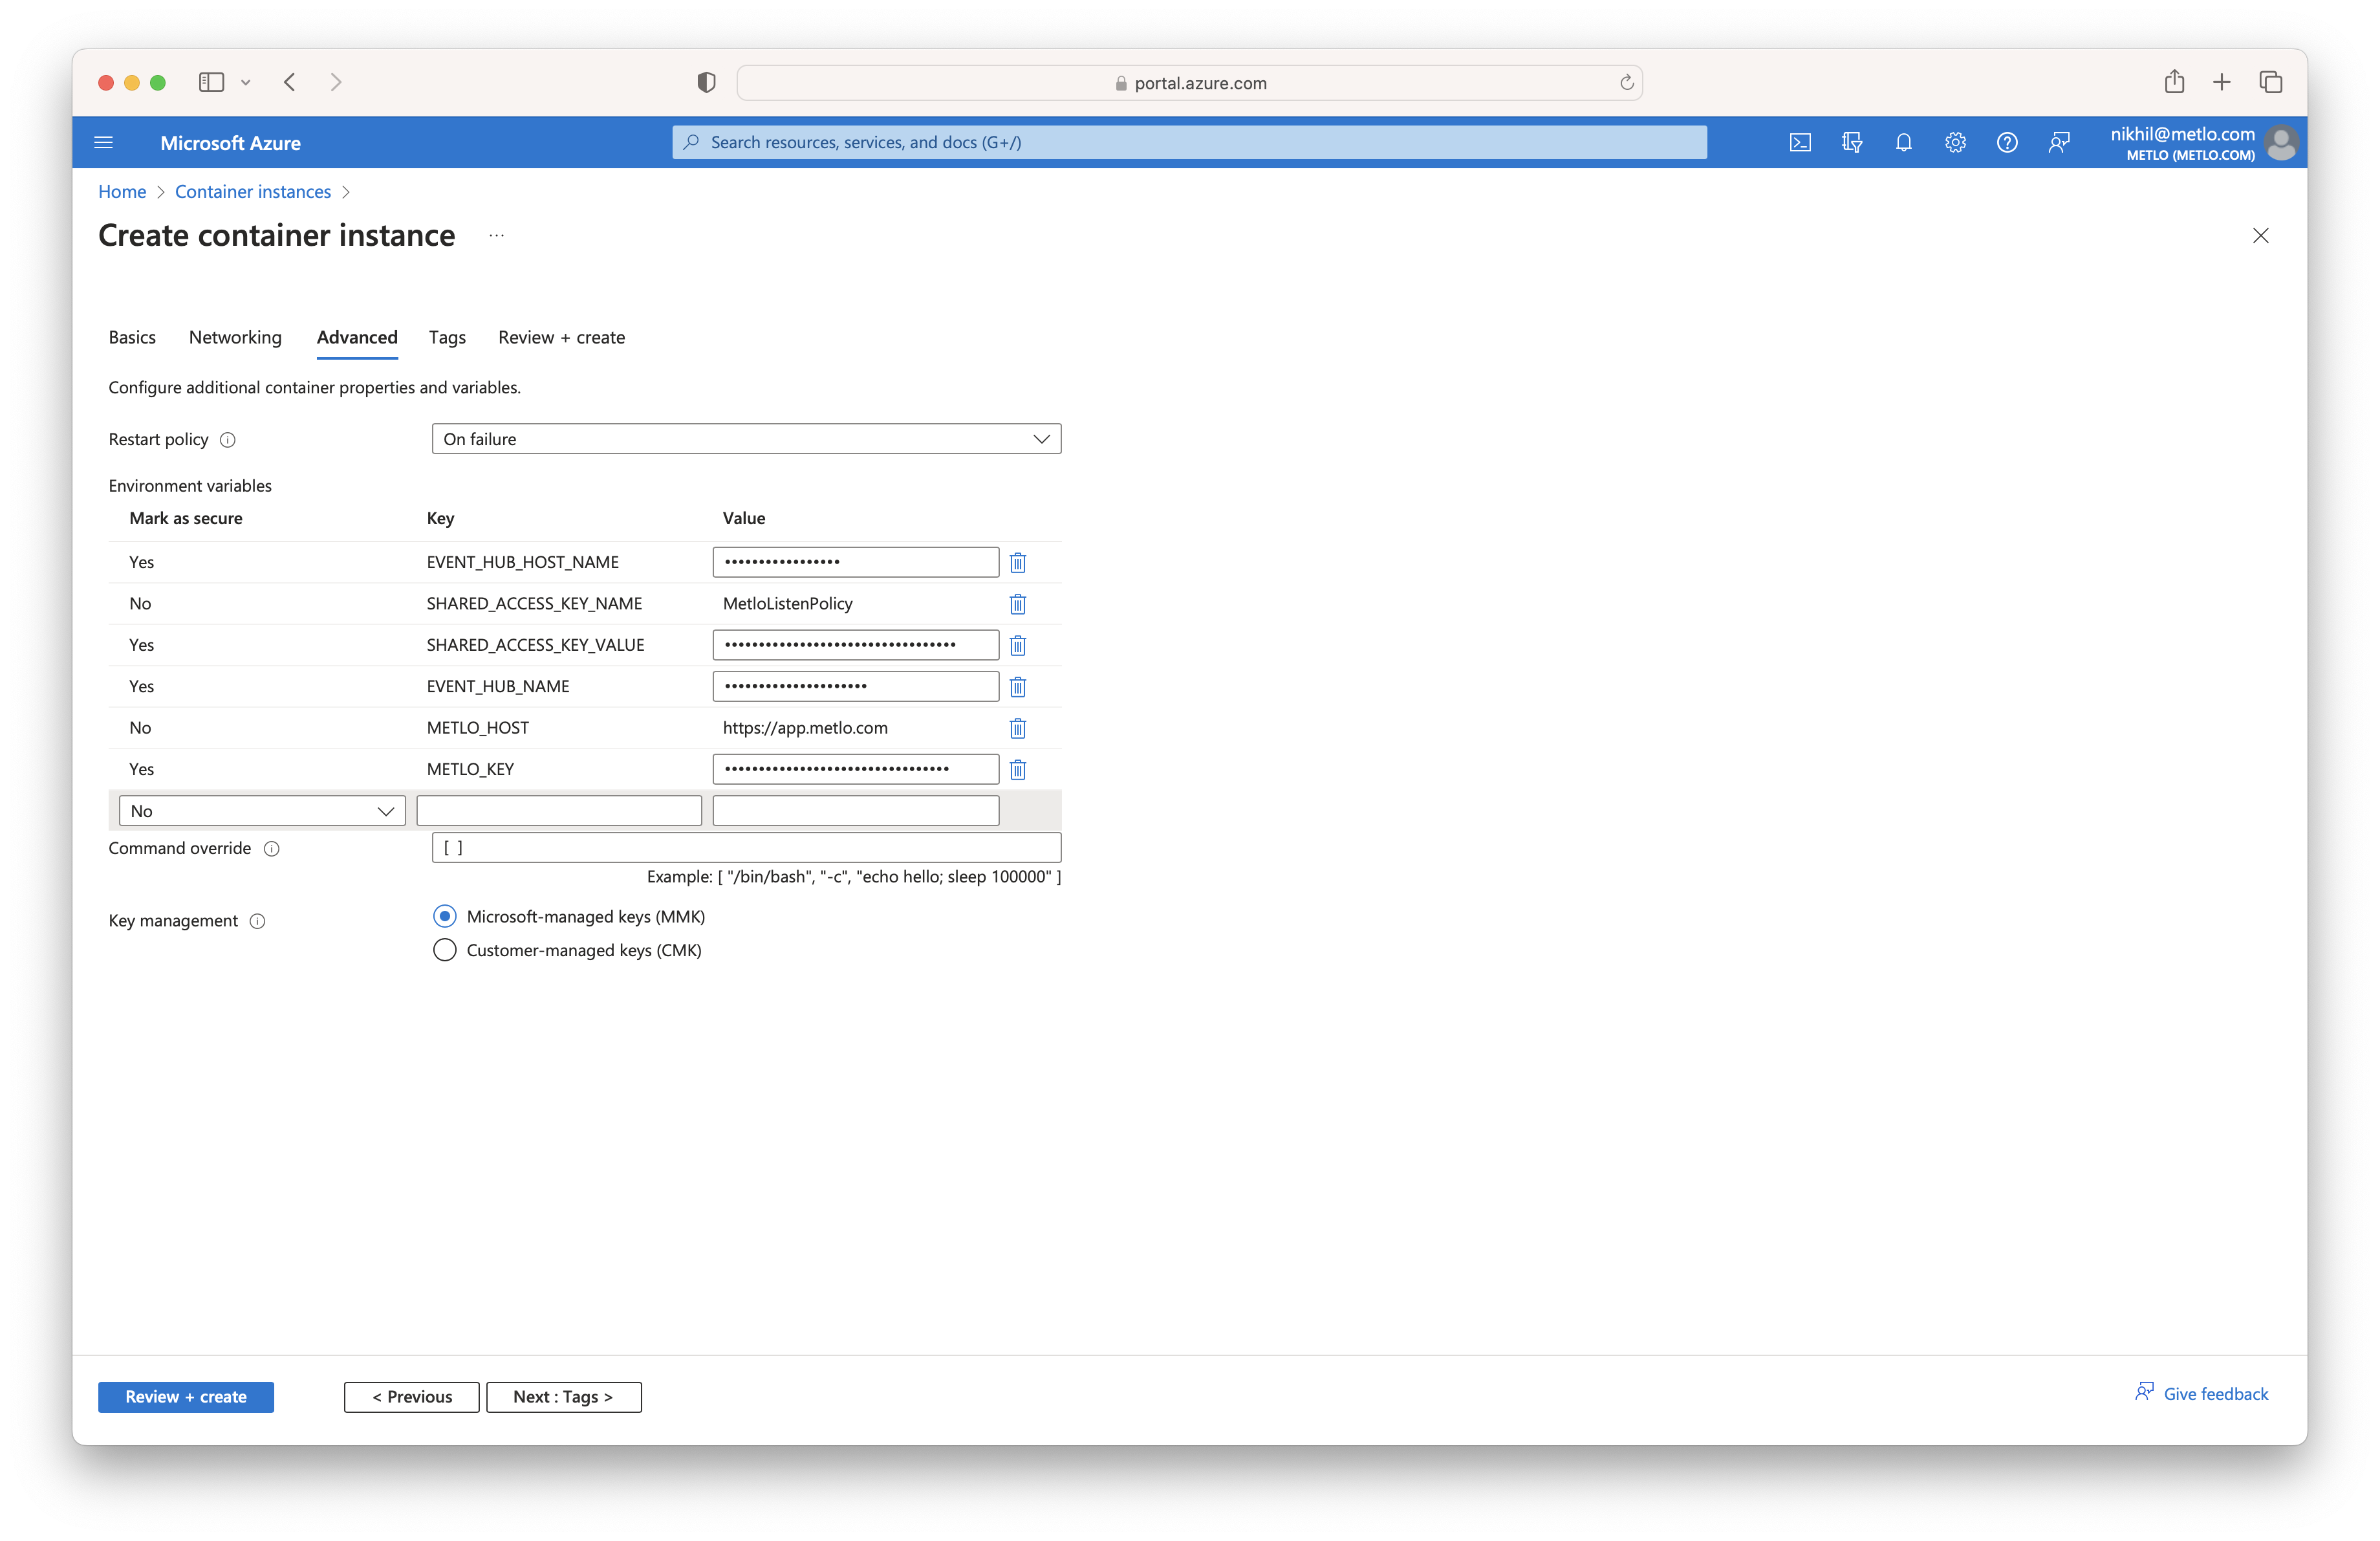
Proceed to the Advanced section of the creation process and set the Restart Policy to On failure. Next,
add the following environment variables: